Small injuries can seriously impair a player. Not only does it stick him on the DL, but it can oftentimes linger and affect his play for weeks, months, or even years down the road. We often see this with wrist injuries — in fact, we’re hoping that Nick Johnson has finally fully recovered from his, allowing him to regain some of the power that was absent last year.
Any hand injury presents cause for concern. Just look at Coco Crisp. When the Red Sox traded for him before the 2006 season it looked like he was becoming a solid regular. He improved his batting average and OBP in 2004, and then added power to his game in 2005, finishing with a 117 OPS+. The next spring, however, he broke his finger and hasn’t been nearly the same since. The closest he’s come was in 2008 when he had a 93 OPS+.
Brett Gardner suffered a fractured thumb last summer, causing him to miss 43 days. This came at a bad time, as Gardner was finally heating up after starting the season in a slump. In April he hit .220/.254/.271 in 65 PA and lost his starting job to Melky Cabrera. From May 1 through his injury on July 27 he hit .298/.393/.454 in 166 PA. Upon his return he slipped back towards his April marks, .250/.308/.292 in 53 PA. We’re dealing in small samples here, but I’d still like too examine this a bit further.
Tommy Rancel at DRays Bay used the Texas Leaguers Pitch f/x tool to display B.J. Upton’s spray charts as he dealt with a shoulder injury. It’s a neat idea, seeing a player’s hit breakdown pre- and post-injury. Often we deal in small samples, but that doesn’t mean we can’t examine it. It means, instead, that it offers little predictive value. There are just so many random factors at play that can mess with a sample of this size.
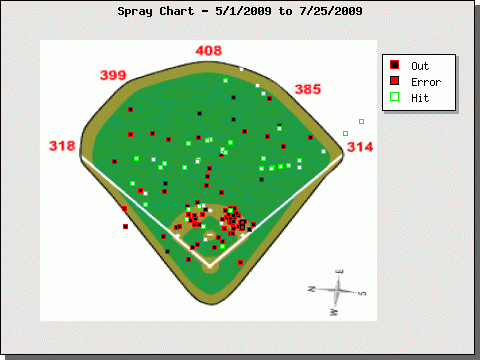
Here’s Gardner’s spray chart from when he started heating up, May 1, through his injury on July 25:

To the shallow outfield he has a pretty even distribution. Clearly his power works to straightaway right and to the gap in right-center. He’ll never hit for power the opposite way, though that’s not of much concern for a player like Gardner. Other than the power hits, though, I think this is as even as you’re going to see. Even the outs are fairly even.
(See that green dot almost sitting on the left field line? Remember that one? Yeah, I do.)
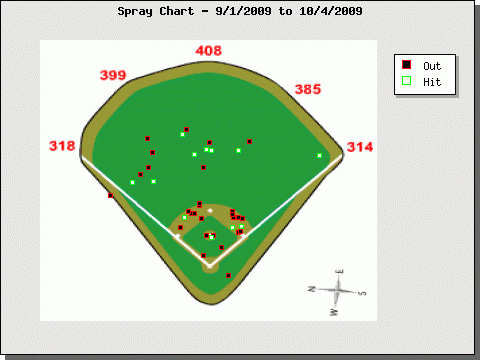
Now for his spray chart after the injury:

Well, well. There seems to be an abundance of green in left field. Gardner hit the ball the other way far more frequently after his return. Again, this is in short sample. He saw only 224 pitches in that time, so it’s understandable that we might see an aberration. Maybe his thumb injury didn’t have anything to do with his lack of balls pulled to the outfield in September. Maybe he was seeing more pitches on the outside half. In fact, as you can see in the pitches he swung at and the pitches he took, that might be the case.
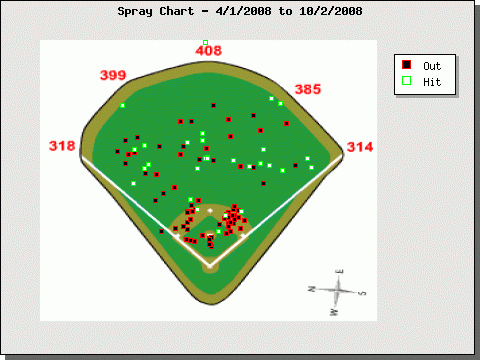
Even in 2008, during Gardner’s short stint in New York, he hit the ball to all fields. Here’s his spray chart for that year:

Did Gardner’s thumb injury affect his swing? As I said at the top of the post, and then again a few paragraphs above, it’s tough to say that with any certainty, given the small samples we’re dealing with. Something did change in September, though. Gardner went from spraying the ball evenly in the outfield to hitting balls up the middle and slapping them the other way. There might be a pitch bias on display, which makes me hesitant to declare the problem his thumb. There’s certainly a connection, so I wonder if Gardner, fully recovered, can return to the form he displayed from May through July.
Leave a Reply
You must be logged in to post a comment.