The Yankees had the best offense in baseball last year, and frankly it wasn’t all that close either. They led the big leagues with a .362 team on-base percentage (Boston was second at .352) and a .478 slugging percentage (Boston was again second at .454), and their .283 team batting average was just two points behind the Angels for the baseball’s best. And before you try the bandbox excuse, you should know that the team’s road OBP (.355) was still the best in baseball, ditto their SLG (.466). Their road AVG was identical to their home AVG.
Last Friday, Andy Hellicksonstine (clever) at DRays Bay took a look at Tampa’s 2009 offense by comparing their actual output with their expected output based on xBABIP, which inspired this post. xBABIP is expected batting average on balls in play, and if a player has a higher xBABIP than BABIP, it means they were a little unlucky. You would have expected to see them pick up a few more hits than they actually did. We always point to BABIP to say so-and-so was lucky/unlucky last year, however BABIP itself is pretty simplistic. It doesn’t consider the type of balls the batter puts in play (LD > GB > FB), which xBABIP does. If you want to learn more about xBABIP, then JFGI.
Let’s take a look at how the Yanks’ batters actually performed last year compared to what we’d expect. If any table in this post is tough to read, click on it to open a larger view. Don’t worry, they’ll all open in fresh tabs.
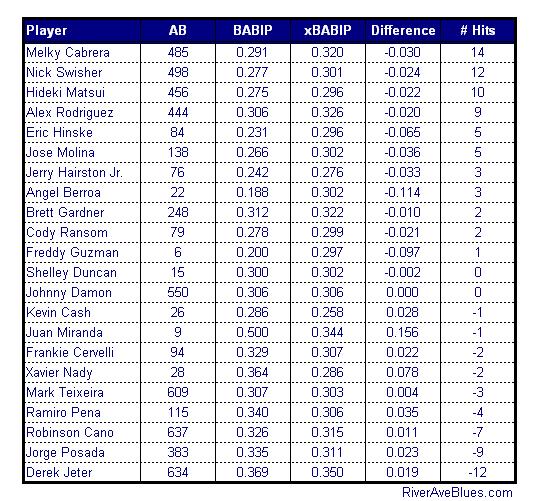
“# Hits” is the number of hits a player lost due to their actual BABIP, so a negative number means the player got lucky and picked up some hits they shouldn’t have. The departed Melky Cabrera was the unluckiest player on the team, getting screwed out of 14 total hits throughout the year. Derek Jeter, meanwhile, was the luckiest, picking up 12 more hits than he should have. I’m not surprised to see Jeter and Robinson Cano near the bottom of the chart, you don’t hit for that kind of average without picking up some cheapies.
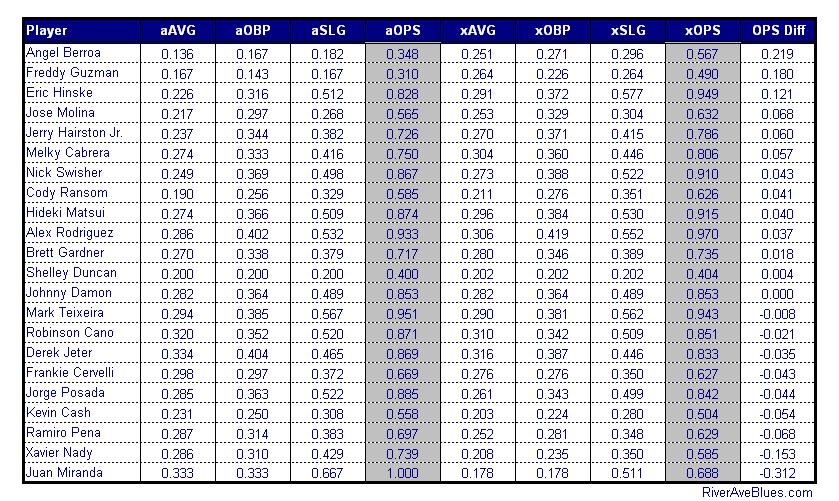
Overall, the Yankees actually lost out on 24 hits due to bad luck last year. If we assume every hit gained/lost was a single (not entirely accurate, but sufficient for the purposes of this post), here’s what each player would have hit last year.
The prefix “a” means actual, “x” means expected. Jeter actually hit .334-.404-.465 in 2009, however we would have expected him to really hit .316-.387-.446, a difference of 35 OPS points. Check out Nick Swisher’s expected batting line, that’s bonafide star offensive production. Melky Cabrera? Well with a little luck, he would have had himself a damn fine season. Not that he didn’t have a fine season, it was good (for him), but it would have been even better if a few bounces went his way. I guess the same holds true for every player.
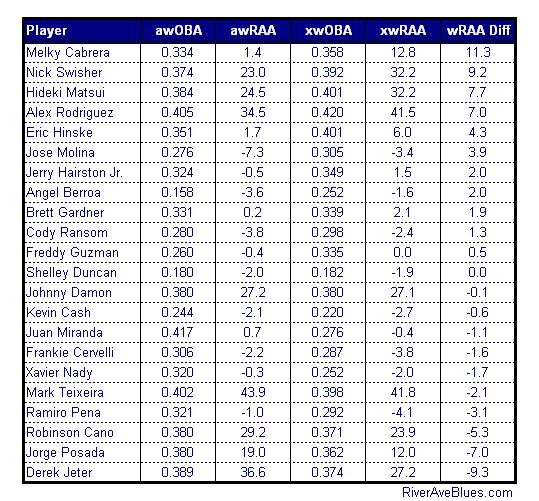
Moving on to some more advanced offensive stats, here’s a comparison of the team’s actual wOBA and wRCAA to their expected values.
wOBA is weighted on-base average, which properly weighs singles against doubles against homers against walks and everything else (regular old OBP considers all hits equal). wRAA is weighted runs above average, which is basically a player’s wOBA minus the league average (divided by a league specific factor) multiplied by plate appearances. That tells you how many more runs a player contributed to his offense over a league average player. In many cases, a player was worse than league average, as you can see from the table above.
Melky got hosed out of more than 11 runs last year, which is basically a full win. As productive as Swisher, Hideki Matsui, and Alex Rodriguez were in 2009, they actually should have been a bit better. Again, it’s not a shock to see Cano and Jeter in the negatives, you don’t rack up as many bulk hits as them without lady luck on your side. As a team, the Yanks unlucked out of 19.1 runs last year. That’s basically two full wins. The best offense in baseball was unlucky last year. Take a second to wrap your head around that.
Of course, Matsui and Johnny Damon are gone now, replaced by Curtis Granderson and Nick Johnson. Let’s see how these two performed compared to expectations.
Sorry I dumped all three tables on you all at once, but long story short is that Granderson was pretty unlucky while NJ was lucky. Yes, I used the appropriate park adjustments. Combined, they were expected to produce almost the same number of runs above average as Matsui by himself. Of course the former two basically had the worse full seasons of their careers at an age when expecting a rebound is more than reasonable, compared to Matsui who had his best season in some time and is at an age when decline could come at any moment.
A full season of A-Rod plus decent rebounds from Granderson and NJ should have this offense back to where it was last season, and if their luck evens out a little bit, it could be even better. Oh, yeah, and they improved their starting rotation. And shed payroll. Be afraid, American League. Be very afraid.


Leave a Reply
You must be logged in to post a comment.